Home prices remain resilient through much of 2026, even as fewer properties change hands, buyers become more selective, and sellers adjust their expectations.
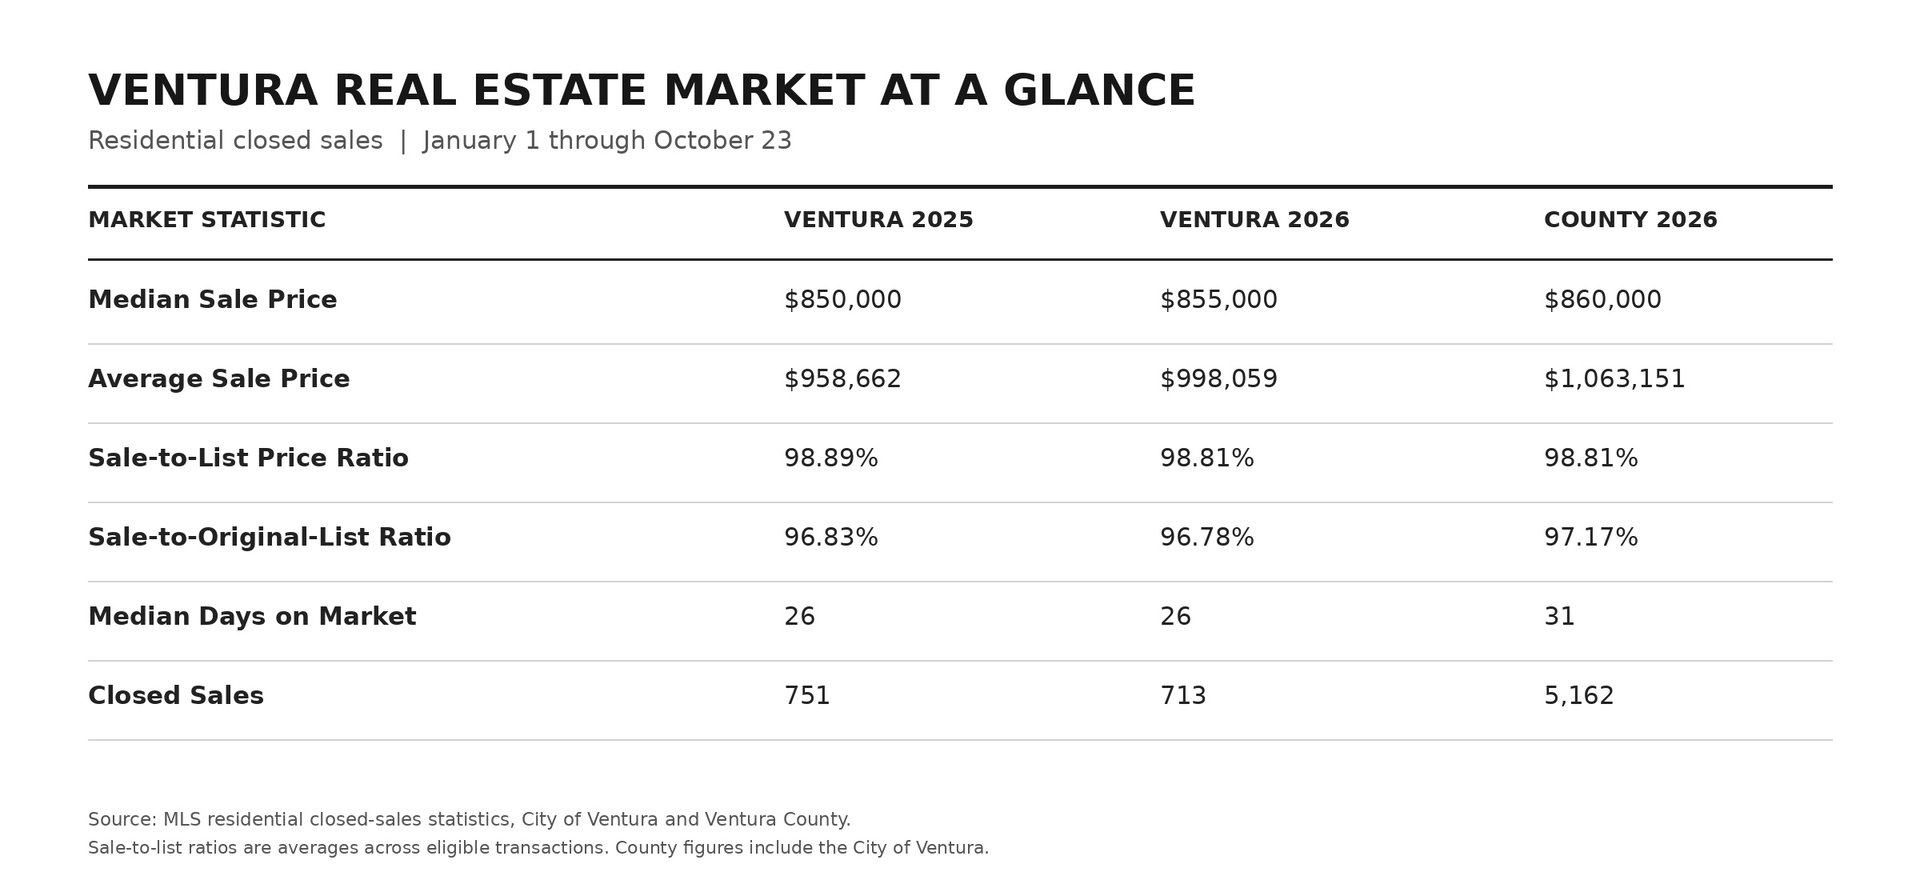
As we approach the end of 2026, Ventura's housing market continues to demonstrate a combination of stability and change. Home prices have remained remarkably resilient over the past year, even as the number of transactions has declined. Buyers are still willing to pay strong prices for desirable properties, but they're also showing greater patience and becoming more selective. The result is a market that looks relatively unchanged when measured by median home prices, but tells a more nuanced story when we examine how homes are actually selling.
According to Multiple Listing Service (MLS) data for the City of Ventura, 713 residential properties sold between January 1 and October 23, 2026. During the same period in 2025, 751 properties changed hands, representing a decline of approximately 5.1% in closed sales. While that may not sound particularly dramatic, it represents 38 fewer transactions in a market where housing turnover is already relatively limited. Interestingly, despite this reduction in sales activity, prices have continued to edge higher.
The median residential sale price in Ventura reached $855,000 during the first ten months of 2026, compared with $850,000 during the same period last year, an increase of approximately 0.6%. The average sale price tells a slightly different story, climbing from $958,662 in 2025 to $998,059 in 2026, an increase of approximately 4.1%.
The distinction between median and average prices is important, particularly in a market like Ventura, where residential properties range from modest condominiums to multimillion-dollar oceanfront estates. A handful of luxury transactions can meaningfully influence the average, while the median represents the midpoint of all sales, with half selling above that figure and half below. For that reason, I generally consider the median a more useful indicator of the broader market, although neither measurement necessarily reflects the appreciation or depreciation of an individual property.
One of the more telling statistics is the relationship between a property's asking price and its eventual selling price. During 2026, Ventura homes sold for an average of 98.81% of their final asking prices, nearly identical to the 98.89% recorded during the same period in 2025. At first glance, this would suggest that buyers have gained very little additional negotiating power over the past year. However, there's an important distinction between a home's original asking price and its final asking price, which may already reflect one or more reductions made while the property was on the market.
When we compare selling prices against original asking prices, the average ratio falls to 96.78% in 2026. That means properties sold for approximately 3.2% below their original asking prices on average, based on the MLS ratios. This is an important consideration for homeowners preparing to sell.
Perhaps the most revealing information in the latest MLS data is the relationship between how long a property remains on the market and the price it ultimately commands. Of the 713 residential properties sold in Ventura this year, 381 spent 30 days or fewer actively listed in the MLS, representing approximately 53% of all closed sales. These properties achieved an average of 100.14% of their final asking prices, meaning homes that sold within their first 30 days generally received full asking price or slightly more.
The numbers change considerably as properties spend more time on the market. Homes that remained listed for 31 to 60 days sold for an average of 97.51% of their final asking prices, while those marketed for more than 120 days achieved just 96.07%. The difference becomes even more pronounced when comparing sale prices against original asking prices. Properties that sold within 30 days achieved an average of 99.83% of their original asking prices, while those that remained on the market for more than 120 days achieved just 87.85%.
That represents a substantial difference and reinforces something I've observed repeatedly in our local market: the initial pricing and presentation of a property can have an enormous influence on the outcome. Homes that are appropriately priced, well-maintained, and located in desirable areas may naturally attract stronger interest. Conversely, properties with unusual characteristics, deferred maintenance, or overly ambitious asking prices may require more time and additional adjustments before finding a buyer.
Despite these differences, the overall pace of Ventura's market has changed very little from last year. The median number of days a residential property spent actively listed in the MLS was 26 days in 2026, exactly the same as in 2025. The average increased only slightly, from 45 days last year to 46 days this year. These figures suggest that while the number of completed transactions has declined, properties that do sell are generally taking about as long to find buyers as they did a year ago.
A look at the homes currently available for sale provides another perspective on Ventura's housing market. As of October 23, there were 194 active residential listings throughout the city, with a median asking price of $975,000 and an average asking price of approximately $1.49 million. Both figures are notably higher than the prices recorded among properties that have actually sold this year. The median asking price is $120,000 above the year-to-date median sale price of $855,000. However, it's important to recognize that these figures represent different groups of properties, and the homes currently for sale tend to be larger than those that have sold. The median active listing measures 1,691 square feet, compared with 1,485 square feet among completed sales.
The amount of time these properties have spent on the market is also worth examining. Active listings have been on the market for a median of 49 days, compared with 26 days for properties that have sold this year. The average active listing has accumulated 76 days on the market, while completed sales averaged 46 days. This comparison isn't entirely surprising, since homes that remain unsold naturally continue accumulating market time. This fact coincides with the seasonal slowdown we experience as we approach the holiday season. Nevertheless, it illustrates an important distinction between the properties that are successfully finding buyers and those still competing for attention. Sellers are making adjustments, too. Among active listings, the median original asking price is $999,000, while the median current asking price is $975,000. Taken together, these figures suggest that while Ventura continues to support relatively strong sale prices, some sellers are finding that attracting today's buyers requires patience, flexibility, and realistic expectations.
The number of active listings also provides some perspective on the amount of housing available to prospective buyers. With 194 properties currently listed for sale and an average of approximately 73 residential sales per month so far this year, Ventura has roughly 2.6 months of inventory when measured against its year-to-date sales pace. This is an approximate calculation rather than a conventional measure based on the most recent month's sales activity, but it offers a useful snapshot of supply relative to demand. At the current year-to-date pace of sales, the existing inventory represents less than three months of transactions, assuming no additional homes enter the market.
These figures also illustrate why it's difficult to characterize the entire housing market as either strong or weak. Two sellers can have dramatically different experiences depending on their property's location, condition, price point, and competition. One home may attract multiple offers within days of hitting the market, while another might spend several months waiting for the right buyer. Both scenarios are occurring in Ventura today, and both contribute to the same overall market statistics.
For homeowners, the latest figures offer some reassurance. Despite continued affordability challenges and a modest slowdown in transaction activity, Ventura's median residential sale price has not experienced a year-over-year decline. For those considering selling, however, the data reinforces the importance of realistic pricing. Buyers are clearly willing to move quickly when a property meets their expectations, but sellers who begin with an overly ambitious asking price may find themselves making increasingly substantial adjustments as their listing ages.
For prospective buyers, the picture is equally nuanced. Well-priced properties can still attract strong competition, particularly during their first few weeks on the market. However, homes that have been available for an extended period may offer greater opportunities to negotiate. Rather than assuming that all sellers are willing to make concessions, or that every property will attract multiple offers, buyers would be wise to evaluate each opportunity individually.
How Does Ventura Compare With the Rest of the County?
Looking beyond city limits provides some additional perspective on Ventura's housing market. Between January 1 and October 23, 2026, a total of 5,162 residential properties sold throughout Ventura County, with a median sale price of $860,000. That's just $5,000 higher than the City of Ventura's median of $855,000, a surprisingly small difference considering the variety of communities and price points represented across the county.
The average sale price countywide was $1,063,151, compared with $998,059 in the City of Ventura. This larger difference may reflect the influence of higher-priced transactions throughout the county, including communities with substantial luxury housing markets. Countywide, the median residential property sold measured 1,699 square feet, compared with 1,485 square feet in Ventura, another reminder that differences in the types and sizes of homes being sold can influence broader pricing statistics.
Homes in the City of Ventura also sold somewhat faster than those across the county as a whole. The median time on market was 26 days locally, compared with 31 days countywide. Average market times were closer, at 46 days in Ventura and 47 days throughout the county. Meanwhile, the average sale-to-final-list-price ratio was identical at 98.81%, suggesting that buyers and sellers are reaching similar agreements relative to final asking prices in both markets.
These comparisons suggest that Ventura is performing much like the broader county market, with relatively stable pricing, comparable negotiating conditions, and a slightly faster pace of sales. They also reinforce the importance of understanding local market conditions rather than relying exclusively on regional or statewide headlines.
Source: Multiple Listing Service (MLS) residential statistics for the City of Ventura and Ventura County, January 1 through October 23, 2026, with City of Ventura comparisons to the same period in 2025. Active inventory figures reflect October 23, 2026. Figures are based on reported MLS transactions and listings and may not include all off-market sales.